Tuolumne Meadows floodplain modeling using HEC-GeoRAS (Part 1)
May 1, 2012 8 Comments
Tuolumne Meadows is a gentle, dome-studded sub-alpine meadowy section of the Tuolumne River, in the eastern section of Yosemite National Park (California). Yosemite National Park’s hydrologic resources include the headwaters of two magnificent rivers—the Merced and the Tuolumne. All of the creeks, streams, and lakes in Yosemite will eventually join with one of these two rivers.
The headwaters of the Tuolumne River arise on the slopes of Mount Dana near Tioga Pass and at the base of Lyell and Maclure glaciers, the two largest glaciers remaining on the west slope of the Sierra Nevada Mountains. The river and its tributaries drain the northern half of the park, passing through deep canyons like Matterhorn, Virginia, Lyell, and the Grand Canyon of the Tuolumne. The Tuolumne watershed is also home to two important California water sources: Lake Eleanor and Hetch Hetchy reservoirs.
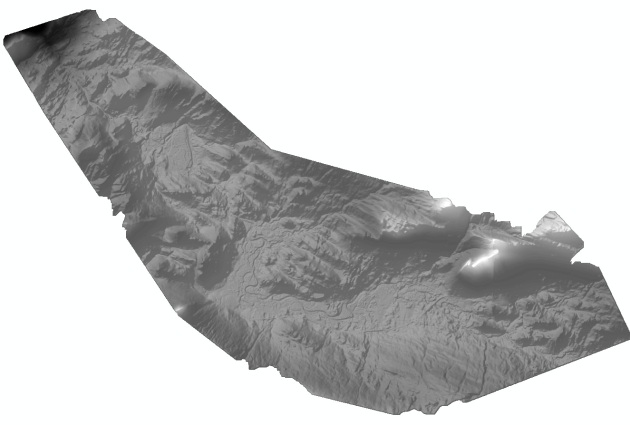
We are going to use the HEC-GeoRAS extension of ArcGIS 10 for pre-processing of GIS data for flood inundation mapping. The only dataset required for HEC-GeoRAS is the terrain data (DEM). In our case, we are using a digital elevation model (DEM) of the Tuolumne Meadows area of Yosemite National Park derived from LIDAR that was flown in September, 2006. All above ground features such as vegetation, buildings, and constructed infrastructure has been removed through processing algorithms to leave a flat earth model of the ground surface.
This dataset can be obtained and used for non-commercial purposes from the U.S. National Park Service Integrated Resource Management Applications website: https://irma.nps.gov/
Start ArcMap 10. Save the ArcMap document (File > Save As…) as “Tuolumne.mxd” in your working folder.
Enable ArcGIS’s Spatial Analyst and 3D Analyst extensions by clicking on Customize > Extensions…
Load the HEC-GeoRAS toolbar into ArcGIS (Customize > Toolbars > HEC-GeoRAS).
Create empty GIS layers using the RAS Geometry menu on the HEC-GeoRAS toolbar. Click on RAS Geometry > Create RAS Layers > All.
In the “Create All Layers” window, accept the default names, and click OK. HEC-GeoRAS creates a geodatabase in the same folder where the map document is saved with its same name. In this case, Toulumne.gdb (you may have to set pathnames in ApUtilities > Set Target Locations).
After creating RAS layers, these are added to the map document with a pre-assigned symbology.
Now we use the Editor toolbar (Editor > Start Editing) to digitize the main stream centerline in River layer (IMPORTANT: always digitize from upstream to downstream).
Digitize the main channel of the Tuolumne River.
Click on ID icon to assign River/Reach Codes and type in name the name of the river (in our case, we only have one river segment):
Click on RAS Geometry > Stream Centerline Attributes > Topology. This creates Topology, Lengths/Stations and assign Elevations to the Rivers/Reaches (creates “River3D” layer).
Again, we use the Editor toolbar (Editor > Start Editing) to digitize stream banks in Banks layer. Bank lines are used to distinguish the main channel from the overbank floodplain areas. Always start from the upstream end and, looking downstream, digitize the left bank first and then the right bank.
Click on RAS Geometry > Create RAS Layers > Flow Path Centerlines. Click “Yes” on the message box that asks if you want to use the stream centerline to create the flow path centerline.
Use the Editor toolbar (Editor > Start Editing) to digitize the left and right overbank center flowlines in Flowpaths layer. The left and right flowpaths must be digitized within the floodplain in the downstream direction.
Label the flowpaths by using the “Select Flowpaths and Assign LineType Attributes” button. click on one of the flow paths (left or right, looking downstream), and name each flow path (Left, Channel, Right).
Use the Editor toolbar (Editor > Start Editing) to digitize the cross sections locations for in XSCutlines layer (IMPORTANT: always digitize from left to right looking downstream).
Go to RAS Geometry > XS Cut Line Attributes to populate River/Reach Names, Stationing, Bank Stations, Downstream Reach Lengths and Elevations data for XSCutlines layer (this creates “XSCutlines3D” layer).
After creating cross-sections, the next step is to define bridges and other structures along the river.
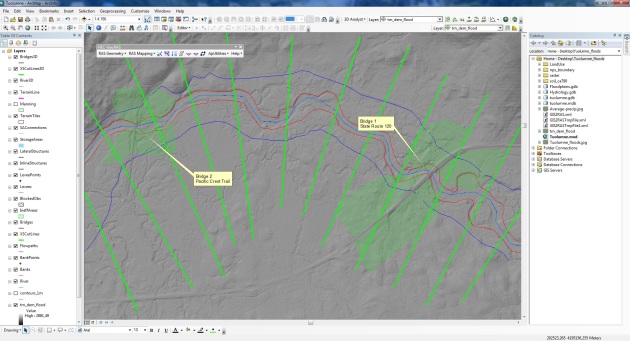
Use the Editor toolbar (Editor > Start Editing) to digitize the bridges location for in Bridges layer. In our map, the Tuolumne River is crossed by the California State Route 120 (Tioga Pass Rd) and by the Pacific Crest Trail, as shown in the next picture:
Next, go to RAS Geometry > Bridge/Culverts to assign river/reach names and station numbers and elevations (this creates “Bridges3D” layer).
Use the Editor toolbar (Editor > Start Editing) to digitize Ineffective flow areas. These are areas with water but no velocity within the floodplain. Areas behind bridge abutments can then be considered as ineffective flow areas.
Go to RAS Geometry > Ineffective Flow Areas > Position, to calculate the position of ineffective areas.
The final step before exporting the GIS data to HEC-RAS is assigning Manning’s n value to individual cross-sections.
We delete the LandUse layer (as we created it empty and has no data), and add the “Manning.shp” shapefile. This file store the Manning’s n values in its attribute table (N_VALUE field).
The data come from the Soil Resources Inventory (SRI) for Yosemite National Park area, which meets the geospatial requirements of the Soil Survey Geographic (SSURGO) database.
Click on RAS Geometry > Manning’s n Values > Extract n Values. Select “Manning” for Land Use, choose “N_Value” for Manning Field, “XSCutLines” for XS Cut Lines, name “ManningTable” for XS Manning Table, and click OK.
Finally, to create an import file into HEC-RAS, go to RAS Geometry > Layer Setup > Required Layers tab. The “Required Layers” tab should have River, XSCutLines and XSCutLines3D for Stream Centerline, XSCutmLines and XSCut Lines Profiles, respectively. In the “Optional Layers” and “Optional Tables” tab, make sure the layers and tables that are empty are set to Null, as show in the picture below:
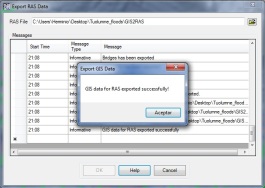
Click on RAS Geometry > Export GIS Data. This process will create two files: “GIS2RAS.xml” and “GIS2RAS.RASImport.sdf”.
That’s it. We are done for now. In later posts I will explain how to import these data into the HEC-RAS hydraulic model.


Pingback: Toulumne Meadows floodplain modeling using HEC-GeoRAS (Part 2) « GIS for Water and Environmental Management
Hi,
Thank you so much for your website, but may i kindly ask you how to install HEC-GeoRAS to ArcGIS
Hi Mira !! Thanks for your comment. Can I ask you what version of ArcGIS do you have installed on your computer and what is your operating system?
hi. thanks for this tutorial. clear and gave me more knowlegde 🙂 but i want to ask you something. i am bachelor student of geomatic science. this semester is final. i have to finish my thesis. my project involve the use of hydraulic data for the purpose to produce flood inundation model. i want to ask you, either actually we need to create all those steps above like following this tutorial to get hidraulic data or actually the hydraulic data should apply from any department? please reply me on my email noorhainiramly@yahoo.com. as soon as possible…please i really need your help 😥
i am malaysian… i really need your help 😥 i only have less then 2 month to finish my project. can you reply me in my email that i already given you in 1st comment. please 😥 can you give me feedback. i need more explaination for the use of hidraulic data in order to produce flood inundation model to know how far those flood will be affect surrounding of study area in malaysia.
Is there a chance to work with the results of Arc hydro tools without the digitizing thing
It seemed that when obtaining the DEM file from IRMA the zipped file Tuolumne_dem_flt.zip yields only tm_dem_flt.e00 furthermore this is just TM_FLT_DEM.STA inside it. Where is the file for the .DEM for it?
The article is actually very good but not for starters so is stripped off of smaller details so the .e00 is a coverage file that needs conversion as described here http://support.esri.com/es/knowledgebase/techarticles/detail/21052